What is “Alchemist”?
Is is the 2nd generation Intel discrete (DG2) graphics – based on the Xe arch that originally powered the integrated graphics of mobile (Xe-LP) processors from Gen 10 (“TigerLake” TGL) onwards. Intel did launch a limited desktop DG1 product as well as a limited server/workstation Xe-HP compute version.
With DG2 – Intel is back with a full stack, from low-end, middle and high-end – as well as workstation/server (data as per Tom’s Hardware : Intel Arc Alchemist: Release Date, Specs, Everything We Know):
- Up to 512CU / 4,096 SP
- A300 series 128CU / 1,024SP
- A500 series 384CU / 3,072SP
- A700 series 512CU / 4,096SP
- Up to 16GB GDDR6
- A300? series 6GB GDDR6 96-bit 14Gbit/s ~192GB/s
- A500? series 12GB GDDR6 192-bit 16Gbit/s ~384GB/s
- A700? series 16GB GDDR6 256-bit 16Gbit/s ~512GB/s
- 7nm TSMC process
- OpenCL 3.0, DirectX 12 Ultimate support
- FP16 half-floating point support
- NO FP64 double floating-point support (!)
- Tensors (“Matrix Engines” aka XMX) for Deep Learning
- FP16 and Int8 support (but no FP32/FP64 support)
- OpenCL extension – will need to be coded specifically to use it
The specification look good – we have competitive specs, although we seem to be missing native FP64 support, just as on the mobile/desktop previous Xe. We do gain tensors (matrix multipliers) and support for FP16/Int8 that should help low-precision neural networks. For high-precision workloads (FP64), it seems AMD is your only option – unless paying nVidia for professional graphics…
ARC “Alchemist” A380 GP-GPU Performance Benchmarking
In this article we test GP-GPU core performance; please see our other articles on:
- GP-GPU
Hardware Specifications
We are comparing the “entry-level” range A380 GP-GPU with the competition with a view to upgrading an inexpensive system.
| Specifications | Intel Arc A380 (DG2) |
nVidia GeForce GTX 1660 Ti | nVidia GeForce RTX 3050 | AMD Radeon RX 6500 XT | Comments | |
| Arch / Chipset | Xe2 (EV12+) | TU116 (Turing) | GA106 (Ampere) | Navi II 24 XT | Gen 12+ graphics – the latest. | |
| Cores (CU) / Threads (SP) | 128 / 1,024 | 12 / 1,536 | 20 / 1,280 | 16 / 1,024 | Similar SPs count as competition | |
| Tensor (TU) Cores | 16 | – | 20 | – | Now with extra tensors on top! | |
| Speed (Min-Turbo) |
~2.45GHz |
1.5-1.78GHz | 1.55-1.78GHz | 2.3-2.6GHz | Turbo speed is pretty high. | |
| Power (TDP) | ~75W | ~120W | ~130W | ~107W | TDP is lowest… on paper at least | |
| ROP / TMU | 32 / 64 | 48 / 96 | 32 / 80 | 32 / 64 | ROPs and TMUs also increased. | |
| Shared Memory |
64kB |
48kB | 96kB | 64kB | Standard shared memory size. | |
| Constant Memory |
2.4GB | 64kB | 64kB | 2GB | Using global as const sadly like AMD. | |
| Global Memory | 6GB GDDR6 96-bit |
6GB GDDR6 192-bit | 8GB GDDR6 128-bit | 4GB GDDR6 64-bit | Quite narrow bus but decent memory | |
| Memory Bandwidth |
~192GB/s | ~288GB/s | ~224GB/s | ~144GB/s | Somewhat low bandwidth | |
| L1 Caches | 64kB | 64kB | 128kB | 128kB | L1 could be larger | |
| L2 / L3 Cache | 1MB | 1.5MB | 2MB | 1MB / 16MB | L2 seems quite small | |
| Maximum Work-group Size |
1,024 x 1,024 | 1,024 x 1,024 | 1,024 x 1,024 | 1,024 x 1,024 | Same workgroup size | |
| FP64/double ratio |
No! | Yes 1/32x | Yes 1/64x | Yes 1/16x | No FP64 support? | |
| FP16/half ratio |
Yes, 2x | Yes, 2x | Yes, 2x | Yes, 2x | Same 2x ratio | |
| Price / RRP (USD) |
~$199? |
~$280 | ~$249 | ~$199 | Keen price | |
Disclaimer
This is an independent review (critical appraisal) that has not been endorsed nor sponsored by any entity (e.g. Intel, etc.). All trademarks acknowledged and used for identification only under fair use.
The review contains only public information and not provided under NDA nor embargoed. At publication time, the products have not been directly tested by SiSoftware but submitted to the public Benchmark Ranker; thus the accuracy of the benchmark scores cannot be verified, however, they appear consistent and pass current validation checks.
And please, don’t forget small ISVs like ourselves in these very challenging times. Please buy a copy of Sandra if you find our software useful. Your custom means everything to us!
Native OpenCL Performance
We are testing both OpenCL performance using the latest SDK / libraries / drivers from both Intel and competition.
Results Interpretation: Higher values (GOPS, MB/s, etc.) mean better performance.
Environment: Windows 10 x64, latest Intel graphics drivers. Turbo / Boost was enabled on all configurations.
| Processing Benchmarks | Intel Arc A380 (DG2) OpenCL | nVidia GeForce GTX 1660 Ti (Turing) CUDA | nVidia GeForce RTX 3050 (Ampere) CUDA | AMD Radeon RX 6500 XT (Navi II) OpenCL |
Comments | |
 |
||||||
 |
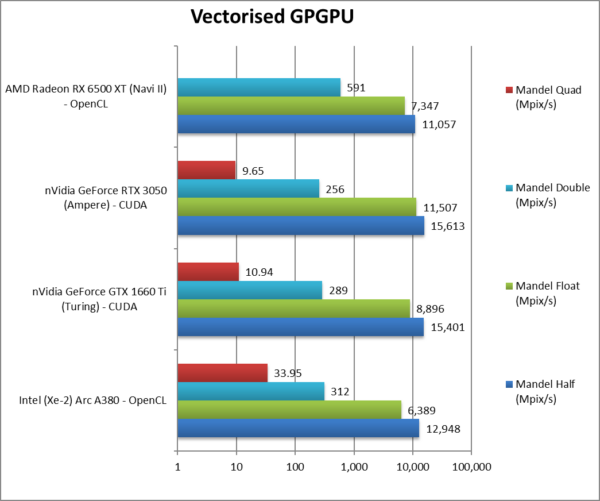
Mandel FP16/Half (Mpix/s) | 12,948 [-17%] | 15,401 | 15,612 | 11,057 | ARC is 17% slower than nVidia. |
|
Mandel FP32/Single (Mpix/s) | 6,389 [-44%] | 8,896 | 11,507 | 7,347 | Standard FP32 is almost 1/2x slower. |
|
Mandel FP64/Double (Mpix/s) | 312* [+22%] | 289 | 256 | 591 | Without native support, ARC is 22% faster! |
|
Mandel FP128/Quad (Mpix/s) | 33.95* [+3.5x] | 10.94 | 9.65 | Emulated FP128 is over 3x faster! | |
| Starting off, we see competitive FP16 performance (beating 2 out of 3) but FP32 performance is the lowest of them all.
Despite having no native support for FP64 – Sandra’s FP32 emulation is faster than the 1/32 or 1/64 ratio of nVidia’s GPUs. AMD is the only one with good FP64 performance. * Emulated FP64 through FP32, no native support (!) |
||||||
 |
||||||
 |
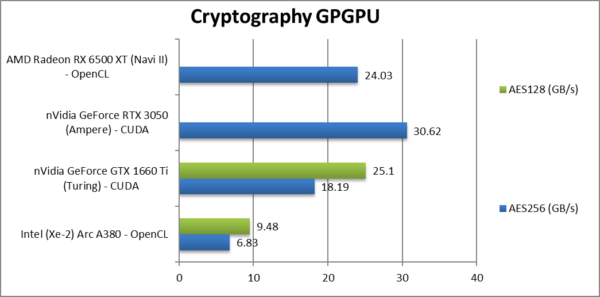
Crypto AES-256 (GB/s) | 6.83 [1/5x] | 18.19 | 30.62 | 24.03 | AES does not suit ARC, it is 1/5x speed of nVidia! |
|
Crypto AES-128 (GB/s) | 9.84 | 25.1 | Nothing much changes here sadly. | ||
 |
||||||
|
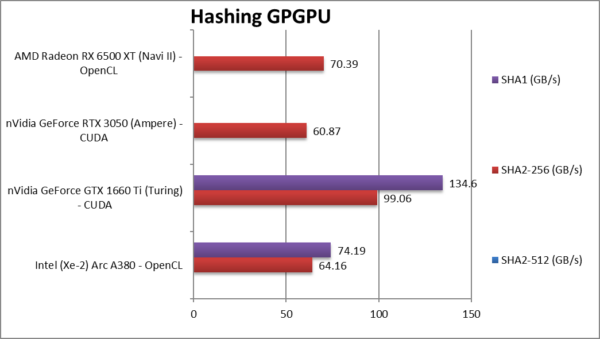
Crypto SHA2-256 (GB/s) | 64.16 [+5%] | 99.06 | 60.87 | 70.39 | ARC is competitive here but not fastest. |
|
Crypto SHA1 (GB/s) | 74.19 | 134.6 | With SHA1 nothing much changes. | ||
| Unlike what we’ve seen when we tested the mobile/desktop Xe versions – ARC does seem not do well in integer workloads, with AES in particular being very slow (some fixes needed, hello Intel?) while hashing is competitive but nothing special.
nVidia (1660) still rules here though AMD usually does well in hashing workloads due to OpenCL extensions that we use for accelerating hashing. We need more! |
||||||
 |
||||||
 |
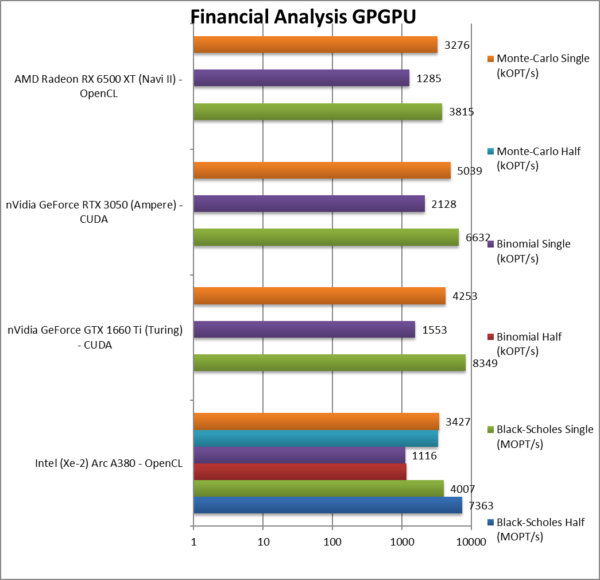
Black-Scholes float/FP16 (MOPT/s) | 7,363 | B/S benefits from FP16 reduction. | |||
|
Black-Scholes float/FP32 (MOPT/s) | 4,007 [-40%] | 8,349 | 6,632 | 3,815 | With FP32, ARC is 40% slower. |
|
Binomial half/FP16 (kOPT/s) | 1,157 | Binomial uses thread shared data thus stresses the memory system. | |||
|
Binomial float/FP32 (kOPT/s) | 1,116 [-48%] | 1,553 | 2,128 | 1,285 | With FP32, ARC is 48% slower |
|
Monte-Carlo half/FP16 (kOPT/s) | 3,340 | Monte-Carlo also uses thread shared data but read-only. | |||
|
Monte-Carlo float/FP32 (kOPT/s) | 3,427 [-32%] | 4,253 | 5,039 | 3,276 | With FP32 ARC is 32% slower. |
| For financial FP32/FP16 workloads, ARC is 30-50% slower than the competition, not something we would expect. Unlike what we’ve seen with fractals, FP16 does not always bring big gains (except on Black-Scholes).
No point to test or mention lack of native FP64 again. You are not going to be running 64-bit financial workloads on this GP-GPU. For a discrete GP-GPU this is a bit unexpected but then again it’s low-end. |
||||||
 |
||||||
 |
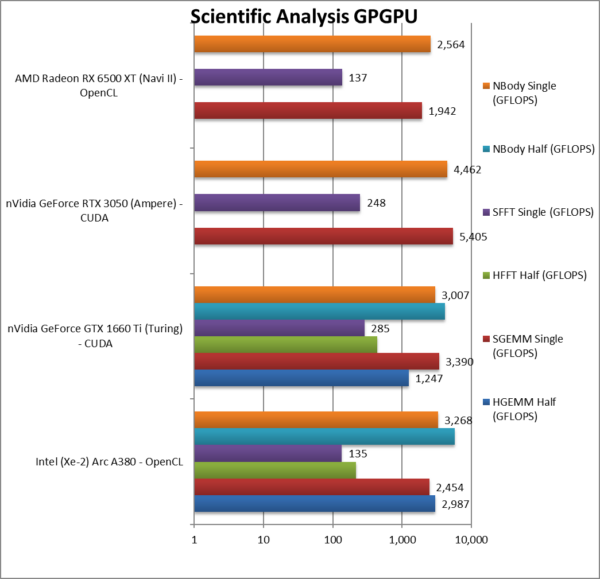
HGEMM (GFLOPS) float/FP16 | 2,987 | 1,247 | ARC does well against nVidia. | ||
|
SGEMM (GFLOPS) float/FP32 | 2,454 [-55%] | 3,390 | 5,405 | 1,942 | With FP32, ARC is 55% slower. |
|
HFFT (GFLOPS) float/FP16 | 218 | 438 | ARC is 1/2 nVidia here. | ||
|
SFFT (GFLOPS) float/FP32 | 135 [-56%] | 285 | 248 | 137 | With FP32, ARC is 56% slower. |
|
HNBODY (GFLOPS) float/FP16 | 5,728 | 4,110 | ARC is 25% faster with FP16. | ||
|
SNBODY (GFLOPS) float/FP32 | 3,268 [-27%] | 3,007 | 4,462 | 2,554 | With FP32, ARC is 27% slower |
| On scientific algorithms (FP32 and FP16), ARC does not do much better – it is again between 25-55% slower than the nVidia competition but at least seems to beat AMD. Hopefully deploying the tensors will improve performance and allow it to gain ground.
Shall we mention lack of FP64 again? No we won’t. |
||||||
 |
||||||
 |
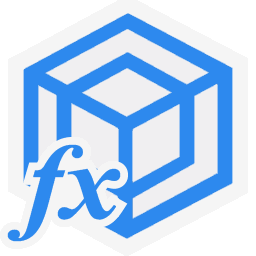
Blur (3×3) Filter single/FP16 (MPix/s) | 7,351 | 10,508 | FP16 performance is better but not 2x. | ||
|
Blur (3×3) Filter single/FP32 (MPix/s) | 5,608 [-56%] | 8,051 | 10,012 | 9,350 | In this 3×3 convolution, ARC is 1/2x speed |
|
Sharpen (5×5) Filter single/FP16 (MPix/s) | 3,748 | 3,915 | Again FP16 is 2x faster. | ||
|
Sharpen (5×5) Filter single/FP32 (MPix/s) | 1,526 [-66%] | 2,161 | 3,482 | 3,629 | Same algorithm but more shared data, 66% slower. |
|
Motion Blur (7×7) Filter single/FP16 (MPix/s) | 1,982 | 3,814 | FP16 is 50% faster. | ||
|
Motion Blur (7×7) Filter single/FP32 (MPix/s) | 1,509 [-57%] | 2,231 | 3,519 | 3,207 | With even more data ARC is 57% slower. |
|
Edge Detection (2*5×5) Sobel Filter single/FP16 (MPix/s) | 3,421 | 3,761 | FP16 is almost 2x faster but not fastest. | ||
|
Edge Detection (2*5×5) Sobel Filter single/FP32 (MPix/s) | 1,530 [-55%] | 2,256 | 3,412 | 3,625 | Still convolution but with 2 filters – 55% slower. |
|
Noise Removal (5×5) Median Filter single/FP16 (MPix/s) | 36.12 | 51.51 | FP16 is over 2x faster! | ||
|
Noise Removal (5×5) Median Filter single/FP32 (MPix/s) | 16.72 [1/5x] | 26.02 | 75.59 | 37.64 | Different algorithm ARC is 1/5 the speed! |
|
Oil Painting Quantise Filter single/FP16 (MPix/s) | 61.76 | 24.91 | FP16 is just 4% faster. | ||
|
Oil Painting Quantise Filter single/FP32 (MPix/s) | 126 [3.2x] | 29.45 | 38.6 | 37.64 | Without major processing, ARC is 3x faster here. |
|
Diffusion Randomise (XorShift) Filter single/FP16 (MPix/s) | 16,216 | 8,311 | FP16 is not much faster. | ||
|
Diffusion Randomise (XorShift) Filter single/FP32 (MPix/s) | 16,147 [-33%] | 19,772 | 21,347 | 14,779 | This algorithm is 64-bit int heavy ARC is 33 slower |
|
Marbling Perlin Noise 2D Filter single/FP16 (MPix/s) | 2,599 | 622 | FP16 is somehow slower. | ||
|
Marbling Perlin Noise 2D Filter single/FP32 (MPix/s) | 3,967 [6x] | 779 | 665 | 6,600 | One of the most complex filters, ARC is 6x faster. |
| For image processing tasks (FP16, FP32), ARC does not improve much – at least it beats AMD – but nVidia has nothing to worry about. (no FP64 processing here, few picture filters would require that kind of precision 😉
FP16 performance is encouraging, though again we have some questionable results – again optimisations and fixes may be needed to take full advantage of improved processing speed. (Hello, Intel?) |
||||||
 |
||||||
 |
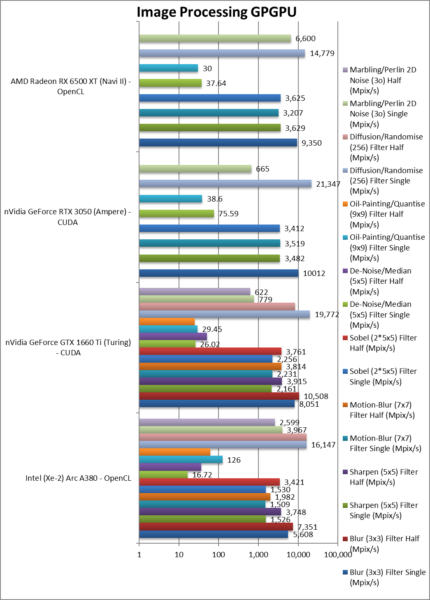
Internal Memory Bandwidth (GB/s) | 137 [-29%] | 238 | 194 | 114 | ARC has 30% less bandwidth. |
|
Upload Bandwidth (GB/s) | 5.23 [-55%] | 12 | 11.71 | 2.88 | Uploads seem to be very slow |
|
Download Bandwidth (GB/s) | 5.21 [-57%] | 12 | 12.25 | 3.06 | Downloads are also slow. |
| ARC seems to have the lowest bandwidth (except AMD) and upload/downloads through the PCIe4 bus are also very slow for some reason. nVidia just dominates everything here. Seems the OpenCL code-path requires some more workarounds. | ||||||
 |
||||||
 |
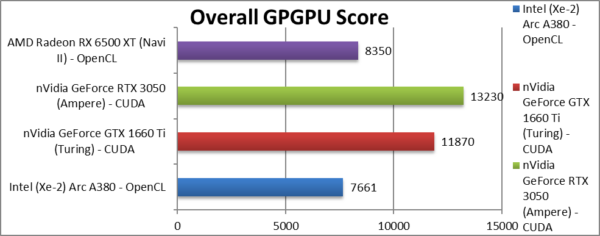
Aggregate Score (Points) | 7,661 [-42%] | 11,870 | 13,230 | 8,350 | Across all benchmarks, ARC is 42% slower. |
| Despite good results overall, ARC seems to still needs some driver work/optimisations to reach its full potential. It ends up 40% slower than nVidia’s 1660 Ti that has the advantage of rock-solid CUDA against variable OpenCL performance. | ||||||
 |
||||||
 |
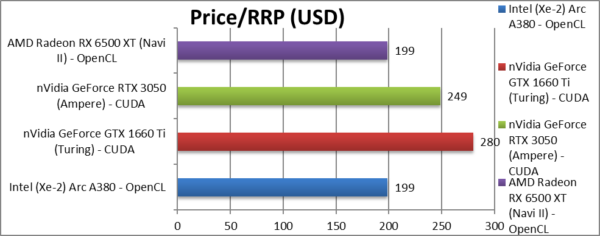
Price/RRP (USD) | ~$199 [-20%] | ~$280 | ~$249 | ~$199 | The price is good at 20% lower than nVidia. |
 |
||||||
|
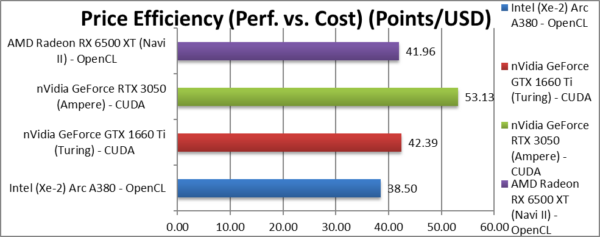
Price Efficiency (Perf. vs. Cost) (Points/USD) | 38.50 [-28%] | 42.39 | 53.13 | 41.96 | ARC ends up the 28% less price effective. |
| Going by RRP prices, ARC ends up the least value out of them all – 28% less “bang-per-buck” than nVidia’s 1660 Ti; it is lower than even AMD’s Navi II.
Yes, nVidia still rules despite the higher price – you do get much better overall performance – but you need to pony up more money. You get what you pay for, right? |
||||||
 |
||||||
 |
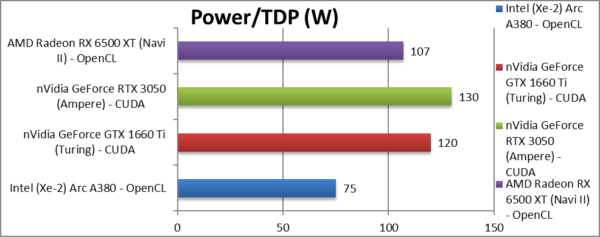
Power/TDP (W) | ~75W [-42%] | ~120W | ~130W | ~107W | ARC’s TDP is 42% lower than nVidia’s. |
 |
||||||
|
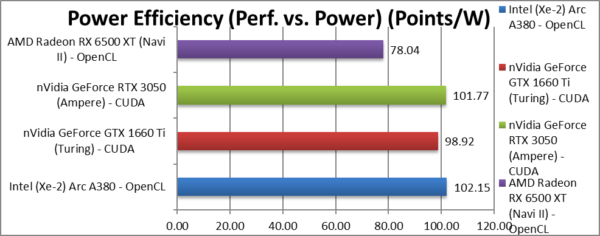
Power Efficiency (Perf. vs. Power) (W) | 102 [=] | 99 | 102 | 78.04 | Somehow ARC ends up absolutely tied with nVidia. |
| Going by TDP (which may or may not reflect reality) – ARC ends up absolutely tied up with nVidia’s 1660 Ti – no mean feat. nVidia’s 3050 ends up a whisker less efficient and AMD brings up the rear. | ||||||
SiSoftware Official Ranker Scores
- Intel Arc (Alchemist) A380 Graphics
- Intel Arc “Alchemist” A370M Mobile Graphics + Intel Iris Xe Internal Graphics
Final Thoughts / Conclusions
Summary: OK for the price, nothing special: 7/10
Intel is back doing discrete graphics – yay! There are more options at the low end – yay! No need to pair discrete AMD or nVidia GP-GPU with Intel CPU/Mainboard – err… not so fast…
nVidia has nothing to worry about – here we’ve only tested the low-end – and despite being more expensive it is definitely worth it. CUDA performance is the most consistent and even the “old” Turing has no problem dispatching both Intel ARC and AMD “Navi II” competition. Again, OpenCL support still leaves a lot to be desired (both Intel and AMD) and DirectX is really for games, not optimised for compute. Still, the A380 is competitive and should improve with drivers and optimisations – should Intel decide to support ISVs like ourselves – but your 2nd choice should be AMD as Navi has been around much longer and the drivers are mature.
As with integrated graphics versions, we lack FP64 support though at this (entry) level it does not matter – though for the top-end (Xe-HP) lack of it would be quite disastrous. Fortunately, nVidia has hobbled its consumer cards’ FP64 at 1/64x rate which makes it pretty much unusable… AMD is still your choice here if you don’t have the money (who does these days?) and need FP64 native support.
Tensor (matrix multiplier) support should improve performance (GEMM, CNN/RNN neural-networks, image processing) – but is limited to FP16/Int8 and won’t help standard FP32 performance. We will likely have to wait for updated tensors in future versions – just as nVidia has done with “Ampere”.
Perhaps it was too much to expect a nVidia/AMD killer – but all in all it is a decent effort. YMMV (Your Mileage May Vary).
Summary: OK for the price, nothing special: 7/10
Please see our other articles on:
- GP-GPU
Disclaimer
This is an independent review (critical appraisal) that has not been endorsed nor sponsored by any entity (e.g. Intel, etc.). All trademarks acknowledged and used for identification only under fair use.
The review contains only public information and not provided under NDA nor embargoed. At publication time, the products have not been directly tested by SiSoftware but submitted to the public Benchmark Ranker; thus the accuracy of the benchmark scores cannot be verified, however, they appear consistent and pass current validation checks.
And please, don’t forget small ISVs like ourselves in these very challenging times. Please buy a copy of Sandra if you find our software useful. Your custom means everything to us!